Installing PyDotPlus and Graphviz
Contents
What is Graphviz?
I used Graphviz to diagram the model of a Deep Learning network in Python.
Graphviz is an open source tool developed by AT&T Labs to draw graph structures written in DOT language.
In order to use Grapviz with python, you need to install PyDot as a set.
However, PyDot is no longer under development, so I installed its successor, PyDotPlus.
Python → PyDotPlus → DOT language → Graphviz → Charts
The above flow produced a png file with the following Deep Learning model diagram.

Environment
Environment is as follows.
OS | Windows 10 Home(64 Bit) |
Anaconda | Anaconda Navigator 2.0.3 |
Python | Python 3.8.5 |
Installing Graphviz
First, install Graphviz.
Download
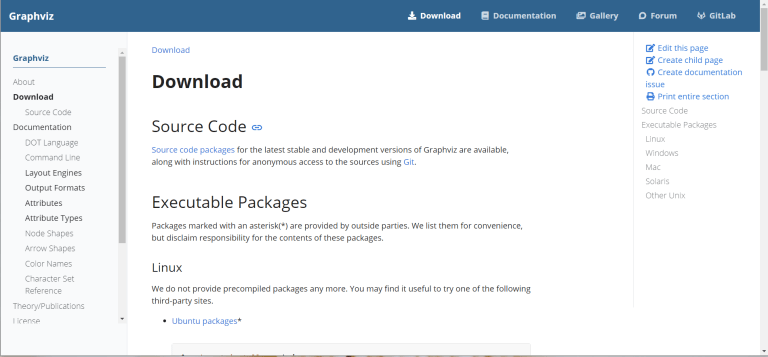
Go to the Graphviz download page.

Scroll down to the bottom and download the installer for Windows 10 (64-bit).
In addition to Windows, the following operating systems are also available
- Linux
- Mac
- Solaris
- Other Linux(FreeBSD)

Run the installer
Run the exe file downloaded.
The setup wizard will appear and click “Next.

Review the license agreement and click the “I agree” button.

Select “Add Graphviz to the system PATH for all users” and click the “Next” button.
The path of the bin folder where Graphviz is installed will be added to the PATH environment variable.

Confirm the destination folder and click the “Next” button.

Select the Start menu folder and click the “Install” button.

When the installation is finished, click the “Finish” button.

Operation check
From the command prompt, go to C:\Program Files\Graphviz\bin and execute the following command.
Ver 2.48.0 (20210717.1556) has been installed.
dot -V
If the PATH to C:\Program Files\Graphviz\bin exists, there is no need to move the current directory.
If not, add the PATH manually.
This completes the installation of Graphviz.
Installing PyDotPlus
The next step is to install PyDotPlus, which outputs the DOT language from Python.
I installed it from the command prompt with the following command.
pip3 install pydotplusFor Python 3.x-only environments, use the pip command as well.

This completes the installation of PyDotPlus.
Source code
The following is an excerpt of the source code for the part that displays the model diagram.
from IPython.display import Image

f_model = model.get_static_model()
FILENAME = 'model-dl.png';
tf.keras.utils.plot_model(f_model, show_shapes=True, show_layer_names=True, to_file=FILENAME)
Image(retina=False, filename=FILENAME) # drawing
I was able to confirm that Graphviz outputs the aforementioned model diagram of Deep Learning from Python.
I hope this article will be useful to someone somewhere.


Recent Comments